
Apex Test Execution
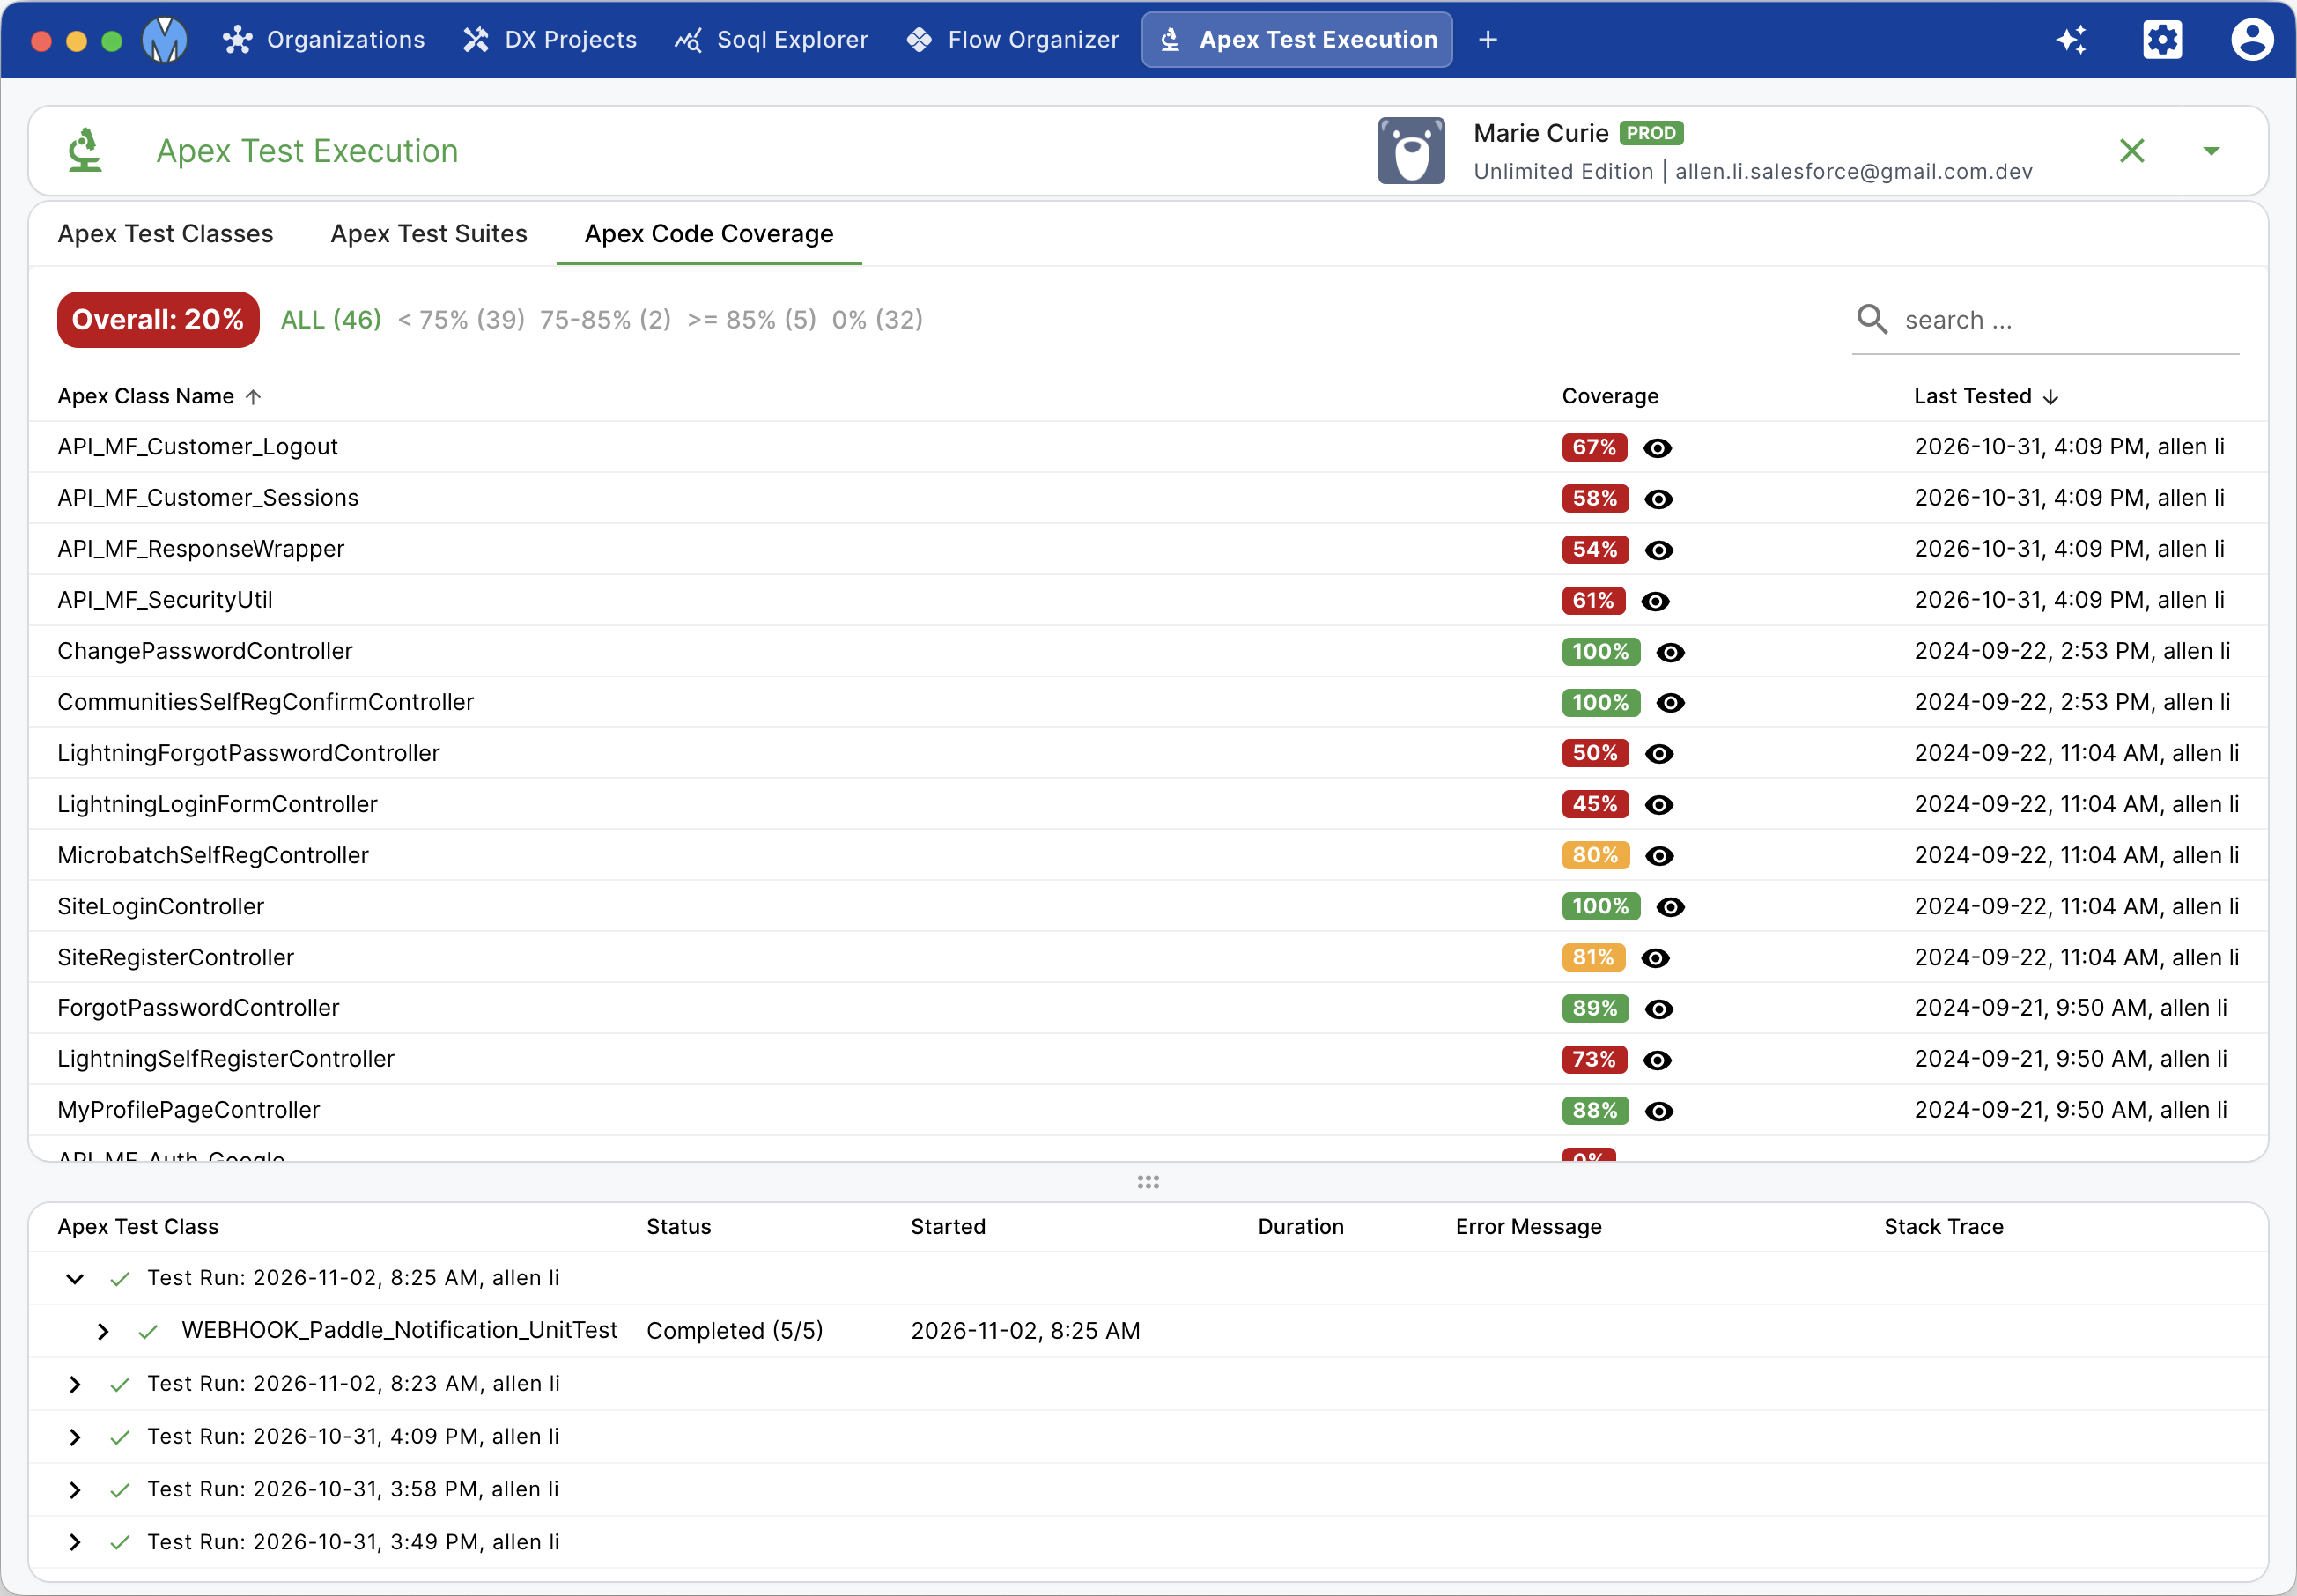
Metaforce Apex Test Execution provides an automated test runner and coverage analysis console for Salesforce developers. Run isolated test classes, orchestrate test suites, monitor background test jobs, and inspect line-by-line code coverage before deploying to production.
Core Capabilities
- Apex Test Classes: Browse, search, and run test classes or specific test methods with one click.
- Apex Test Suites: Group related test classes into custom suites (e.g.
Billing Regression,Trigger Tests) and trigger batch runs. - Test Jobs Monitor: Track asynchronous test execution progress in real-time with pass/fail counts and failure stack traces.
- Overall Code Coverage: View aggregate organization code coverage and detailed coverage percentages for every Apex class and trigger.
- Uncovered Lines Inspector: Identify exact lines and conditional branches that lack test coverage to ensure you meet the 75% deployment threshold.
Running Apex Tests
1. Execute Test Classes
Navigate to the Test Classes tab:
- Search test classes by name.
- Select one or multiple test classes using checkboxes.
- Choose execution options (e.g., enable or disable parallel execution to prevent record lock contention).
- Click Run Selected Tests.
2. Manage Apex Test Suites
Navigate to the Test Suites tab:
- Click New Test Suite to create a named suite.
- Add or remove Apex test classes from the suite editor.
- Run the entire suite with a single click during regression testing.
Inspecting Test Results & Failure Stacks
The Test Jobs tab displays live execution results:
- Status Badges: Instant visual feedback for
Completed,Failed, orProcessing. - Method Breakdown: Expand any test class to view the outcome of individual
@isTestmethods. - Failure Diagnostics: Click failed test methods to inspect the assertion failure message and exact stack trace lines.
Organization Code Coverage Analysis
The Overall Coverage tab calculates and presents real-time coverage metrics across your organization:
- Org-Wide Coverage Gauge: Visual percentage indicator showing your organization's total coverage relative to the mandatory 75% Salesforce requirement.
- Class Coverage Breakdown: Sortable table listing all Apex classes and triggers, covered lines count, uncovered lines count, and coverage percentages.
- Coverage Viewer: Click any class to open the code viewer with covered lines highlighted in green and uncovered lines highlighted in red.