
Anonymous Apex
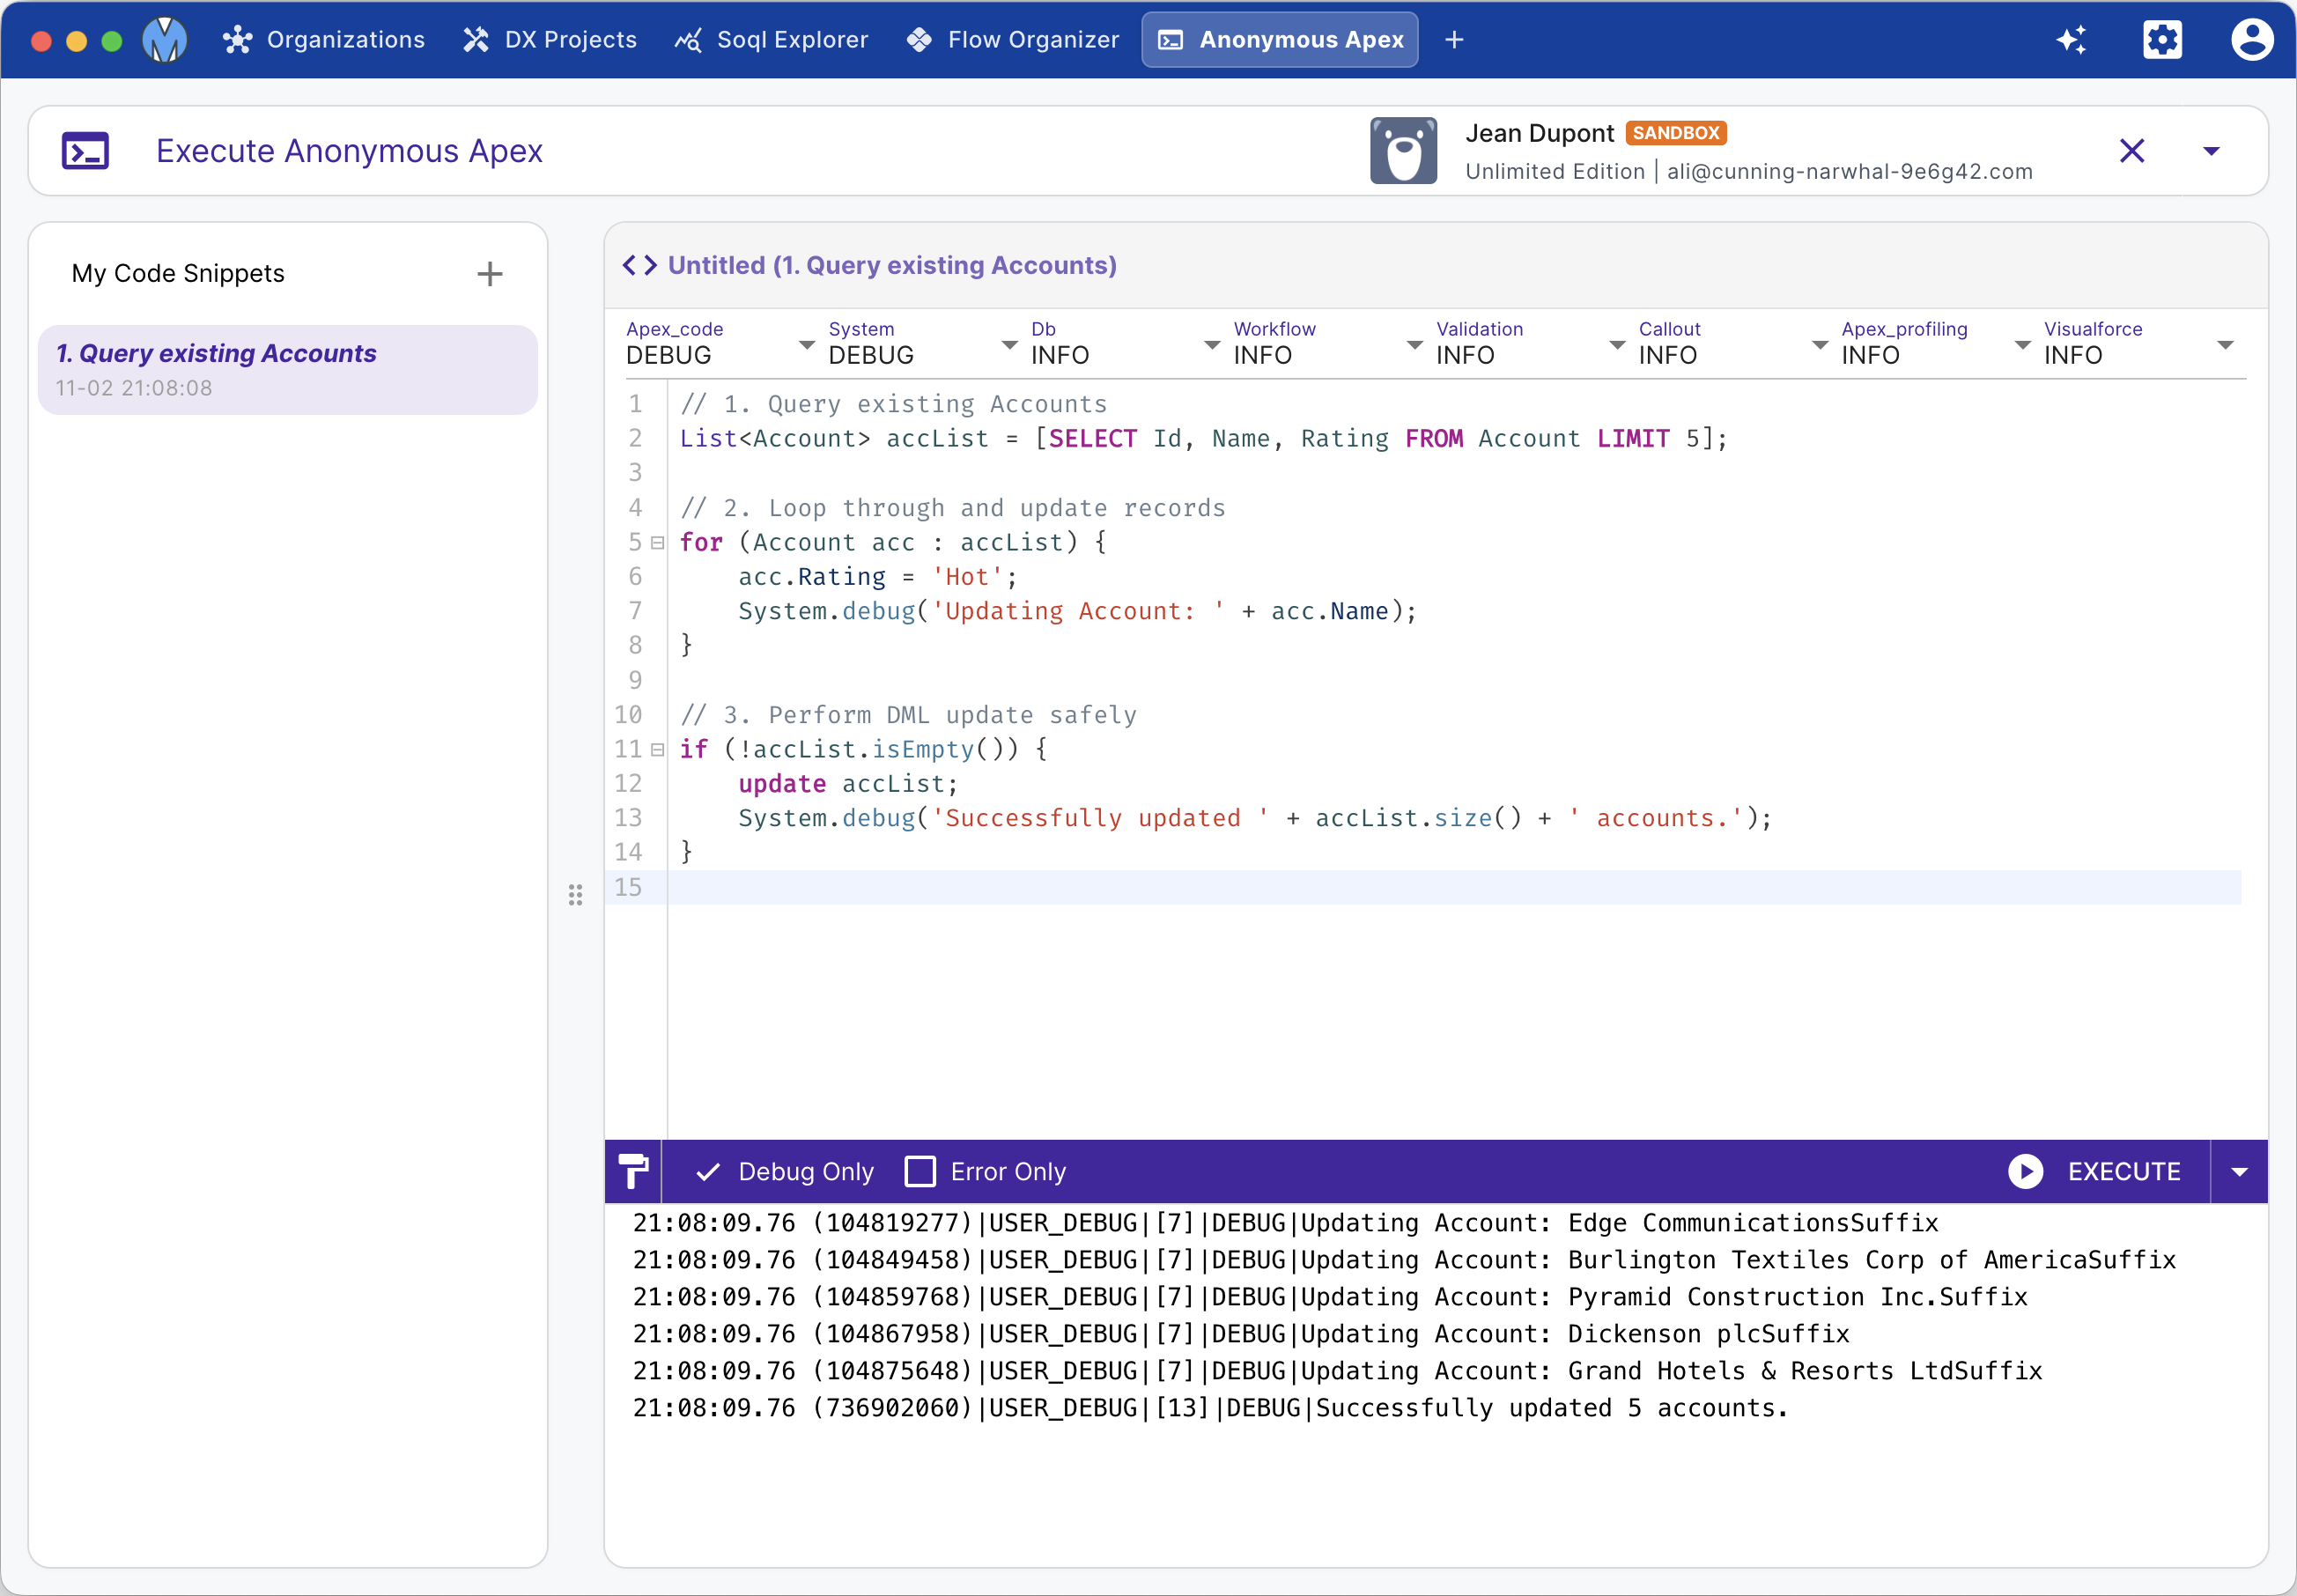
Metaforce Anonymous Apex provides a dedicated execution and debugging workbench for running on-demand Apex scripts. Manage your snippet library, configure granular debug levels, execute batch iterations, and analyze execution logs with intelligent log filtering.
Key Features
- Apex Snippet Library: Organize and persist reusable scripts locally with custom titles, search filtering, and duplication.
- Batch Execution (Loop Runner): Run an anonymous script repeatedly (e.g., 5x, 10x) with batch execution counters to test asynchronous triggers, batch queues, or bulk data generation.
- Granular Debug Levels: Customize logging levels for Apex Code, Database, Profiling, Callouts, and Validation directly from the editor toolbar.
- Log Filtering (Debug Only / Error Only): Toggle instant filters to isolate
USER_DEBUGstatements or runtime exceptions from noisy system execution logs. - Integrated Apex Formatter: Format code instantly via
prettier-plugin-apex(Shift + Option/Alt + F).
Workspace Layout & Execution Flow
1. Snippet Management
The left sidebar hosts your personal Code Snippets:
- Click the + button to create a new script.
- Type in the search box to find saved snippets by title.
- Duplicate or delete snippets with one click.
- Unsaved changes are clearly flagged with a status badge (Unsaved) and automatically persisted.
2. Editor & Debug Configuration
The main editor area provides Apex syntax highlighting, auto-completion, and indentation:
- Set your preferred logging levels before execution to control log granularity.
- Rename the snippet title directly in the header bar.
3. Execution & Batch Runs
- Single Execution: Click Execute or press Cmd/Ctrl + Enter.
- Batch Execution: Click the dropdown arrow on the Execute button to configure the repetition count (e.g., run 10 times consecutively).
4. Analyzing Debug Logs
The bottom log viewer immediately streams the execution log:
- Debug Only: Hides boilerplate platform events and displays only your
System.debug(...)output. - Error Only: Focuses strictly on fatal errors, stack traces, and uncaught exceptions.
- Raw Log: Access full raw transaction logs with timestamps and governor limit summaries.